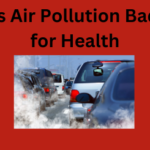
INDIA DOMINATES LIST OF WORLD’S MOST POLLUTED CITIES

A new study by IQAir AirVisual and Greenpeace has identified the cities where air pollution is highest. The list is dominated by India, with seven of the worst 10 cities, and 22 of the worst 30.
The most polluted city on earth is Gurugram, , the next four Indian cities Delhi, which is the most polluted capital on earth, Patna and Lucknow.
The research focussed on the levels of fine particulate matter known as PM2.5. These microscopic particles 20 times smaller than the width of a human hair are the most damaging to human health. They can be metals, organic compounds or the by-products of combustion from coal-fired power stations, wood and charcoal-burning stoves, vehicle engines and factories.
The report also stated that Bangladesh, on average, was the most polluted nation, followed closely by Pakistan and India.Iceland, Finland, Estonia, Australia and Sweden were among the least polluted as per the 2018’s World Air Quality Report.India, the world’s fastest-growing major economy, makes up 22 of the top 30 most polluted cities, with five in China, two in Pakistan and one in Bangladesh.
LEARNING WITH TIMES
PM2.5 means particulate matter in the air – caused by motor exhaust or anything combustible – that is less than 2.5 micrometers.
WHO’s air quality guidelines state that by reducing particulate matter (PM10) from 70 to 20 micrograms per cubic metre, air pollution-related deaths could be reduced by roughly 15 per cent. WHO safe limits for annual mean of PM 2.5 and PM 10levels are 10 and 20 micrograms per cubic meter.
Airborne particles are sometimes referred to as ‘particulate matter’ or ‘PM’. They include dust, dirt, soot, smoke, and liquid droplets. Some particles are emitted directly into the air from a variety of sources that are either natural or related to human activity. Natural sources include bushfires, dust storms, pollens and sea spray.
Those related to human activity include motor vehicle emissions, industrial processes (eg electricity generation, incinerators and stone crushing), unpaved roads and woodheaters. Particles can be classified on the basis of their size, referred to as their ‘aerodynamic diameter’. ‘Coarse particles’ are those between 10 and 2.5 micrometres (µm) in diameter; ‘fine particles’ are smaller than 2.5 µm; and ‘ultrafine particles’ are smaller than 0.1 µm. Studies have linked exposure to particle pollution to a number of health problems including respiratory illnesses (such as asthma and bronchitis) and cardiovascular disease.
INDIA’S STANDARD FOR LEVEL OF POLLUTION
India has set standards for what it thinks are appropriate warnings for a particular level of pollutant. AQI help in comparing pollution levels at a glance with a colour code and a numerical value. In India, AQIs are determined based on the concentrations of seven pollutants, including PM2.5 (fine, respirable particles), sulphur dioxide (SO2), nitrogen dioxide (NO2) and carbon monoxide (CO).There are six AQI categories, namely: Good, Satisfactory, Moderately polluted, Poor, Very poor and Severe.
The Index is centred around five chief pollutants – Particulate Matter with a diameter less than 10 micrometres (PM10), Particulate Matter with a diameter of less than 2.5 micrometers (PM2.5), ozone (O3), Nitrogen Dioxide (NO2), and Carbon Monoxide (CO).
National Clean Air Programme (NCAP) was launched which is a time bound national level strategy for pan India implementation to tackle the increasing air pollution problem across the country in a comprehensive manner .
- It is a five-year action plan to tackle pollution across the country.
- Collaborative and participatory approach involving relevant Central Ministries, State Governments, local bodies and other Stakeholders with focus on all sources of pollution forms the crux of the Programme.
- Overall objective of the NCAP is comprehensive mitigation actions for prevention, control and abatement of air pollution besides augmenting the air quality monitoring network across the country and strengthening the awareness and capacity building activities.
- The tentative national level target of 20%–30% reduction of PM2.5 and PM10 concentration by 2024 is proposed under the NCAP taking 2017 as the base year for the comparison of concentration.
- Other features of NCAP include, increasing number of monitoring stations in the country including rural monitoring stations, technology support, emphasis on awareness and capacity building initiatives, setting up of certification agencies for monitoring equipment, source apportionment studies, emphasis on enforcement, specific sectoral interventions etc.


0 Comments